![]()
Wall Chart
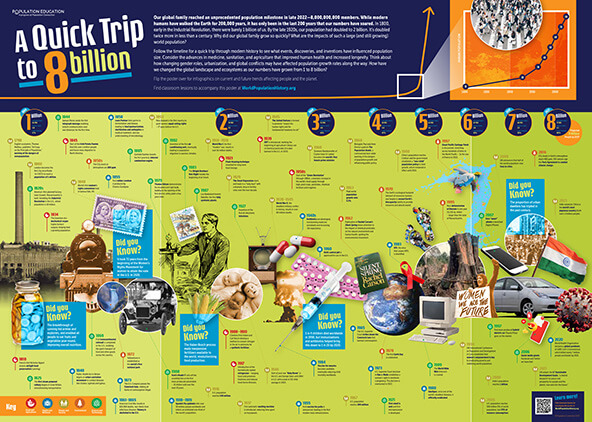
The Quick Trip to 8 Billion wall chart is a classroom poster that marks the addition of Earth’s 8 billionth member in 2022.
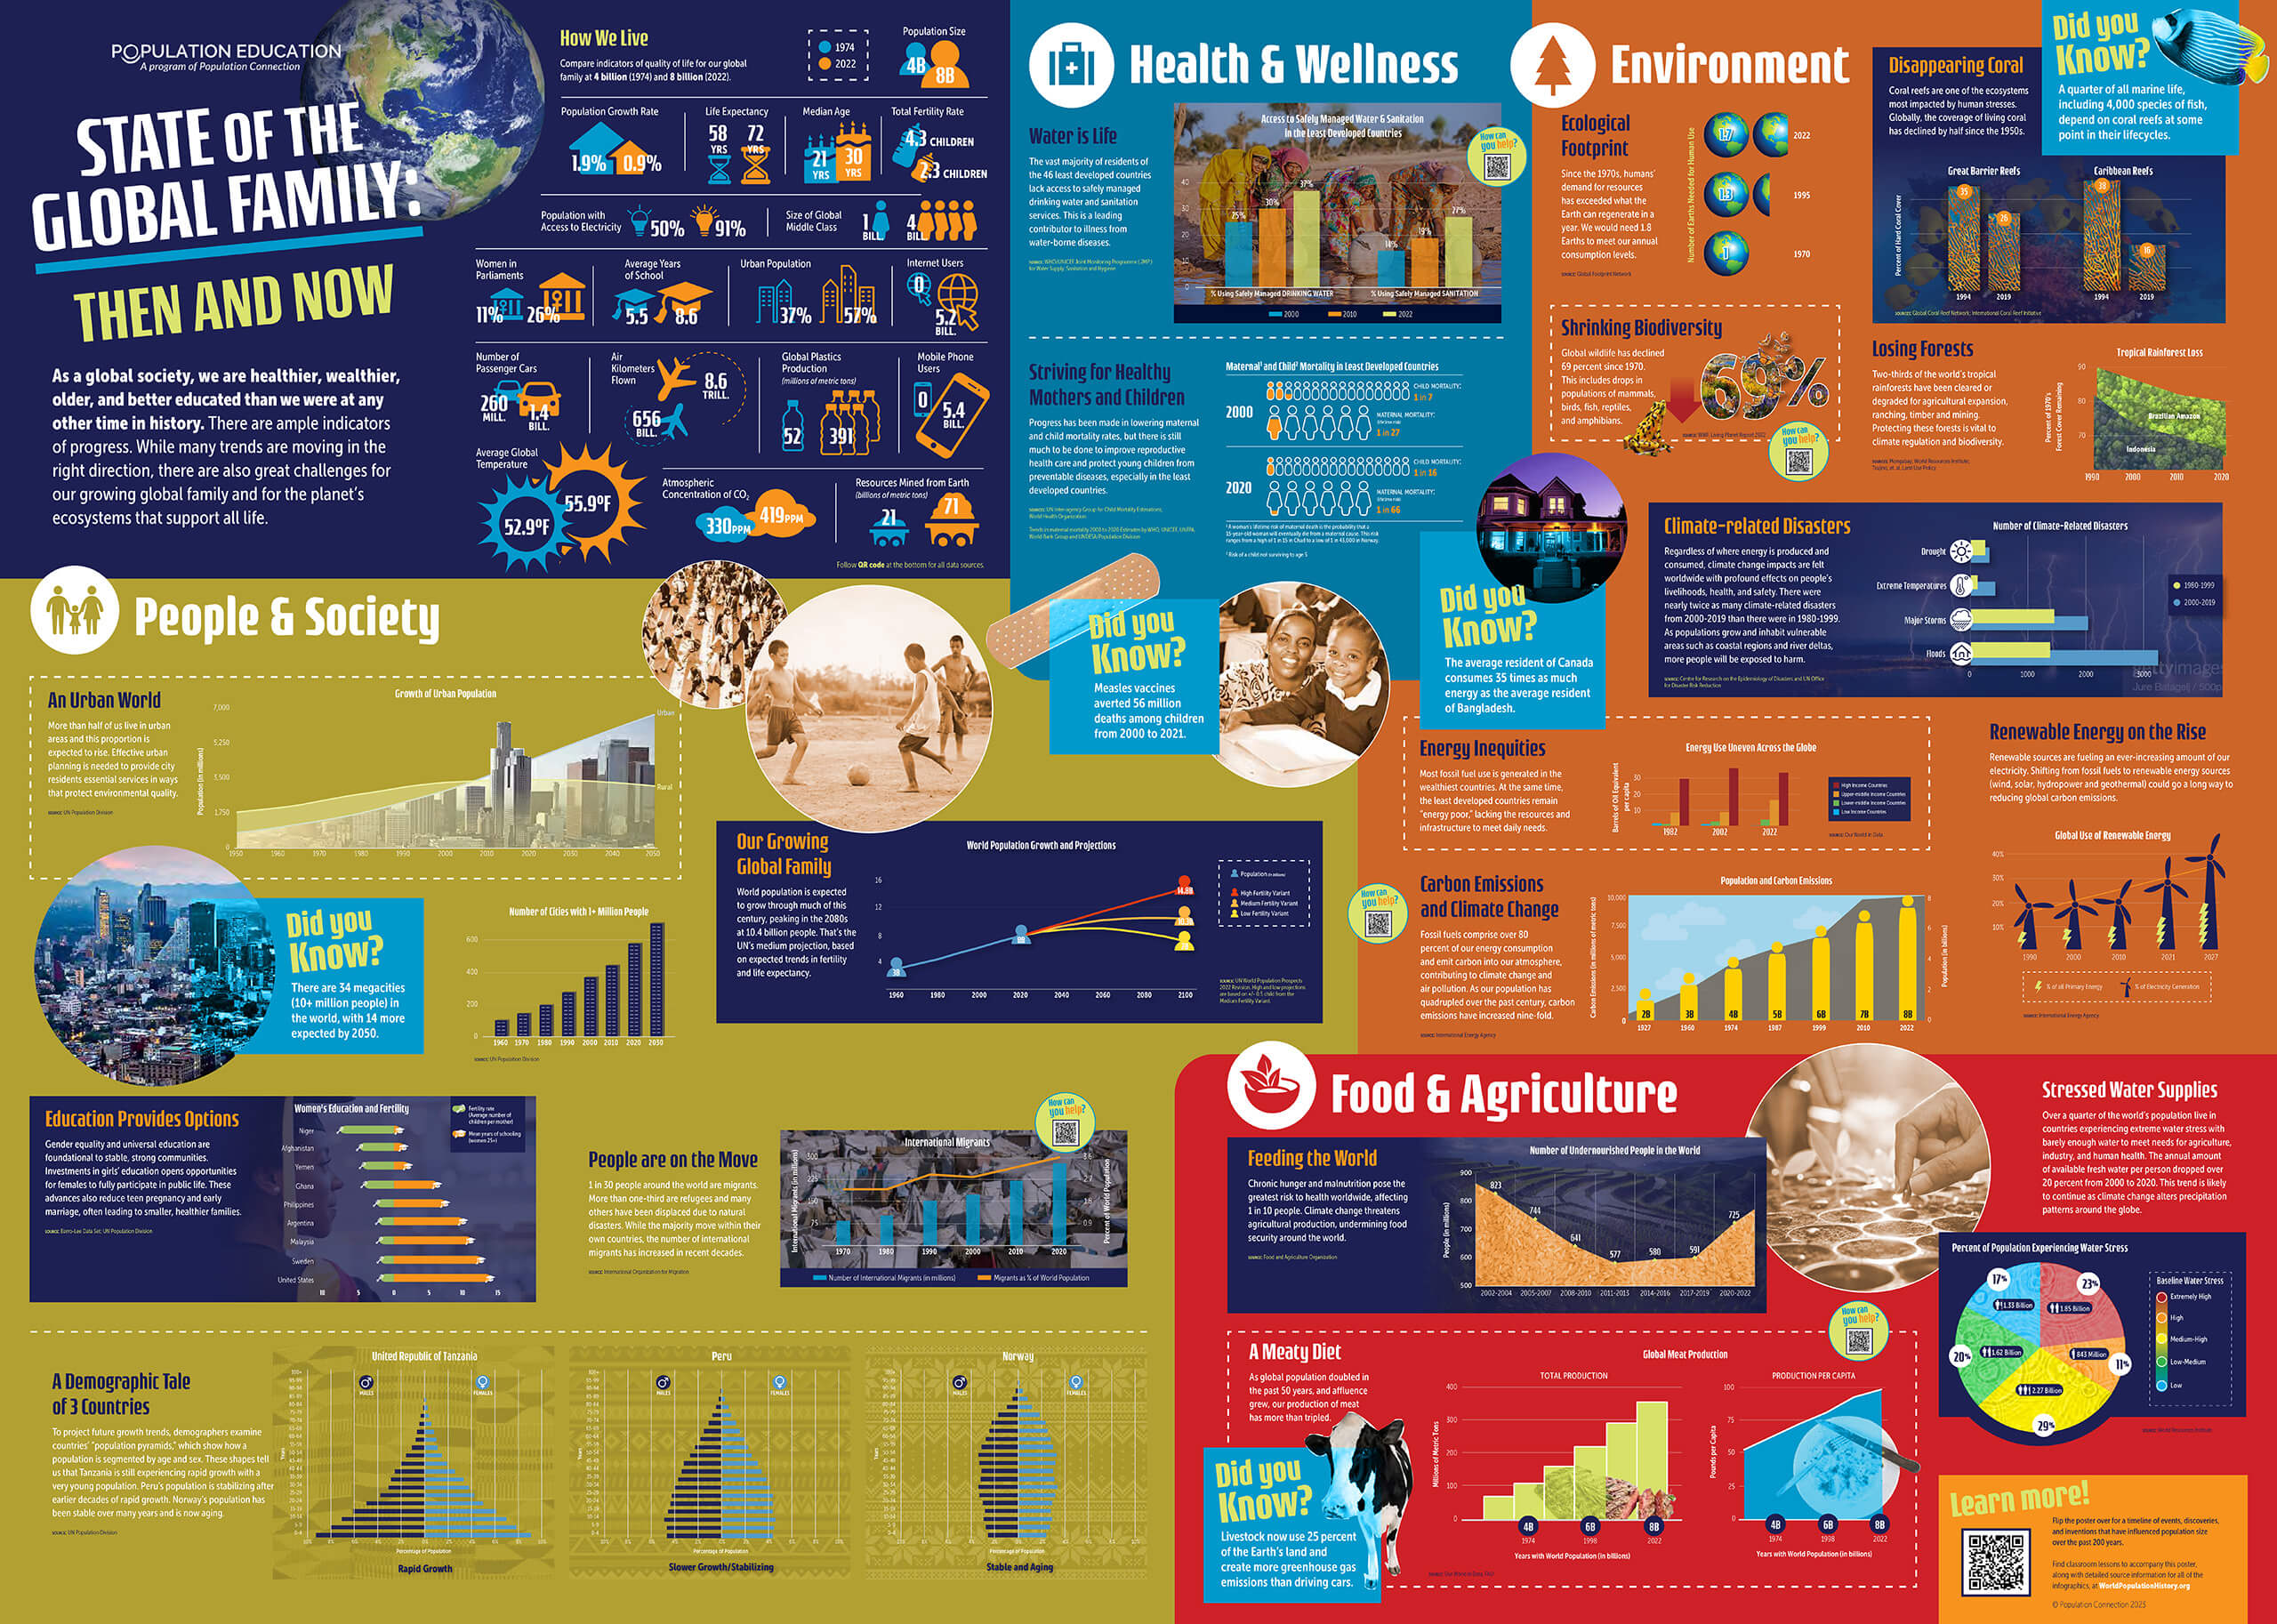
On one side of the wall chart you’ll find a timeline of historical events, inventions and social movements that have affected birth and death rates over the past 200 years, bringing us to 8 billion humans. The other side of the wall chart uses a variety of colorful infographics to show the challenges we face as a growing global family – from meeting basic human needs to the delicate balance of natural ecosystems.
Share the high-resolution version of the poster with students to ensure viewing ease.
View the High-Resolution Version Citations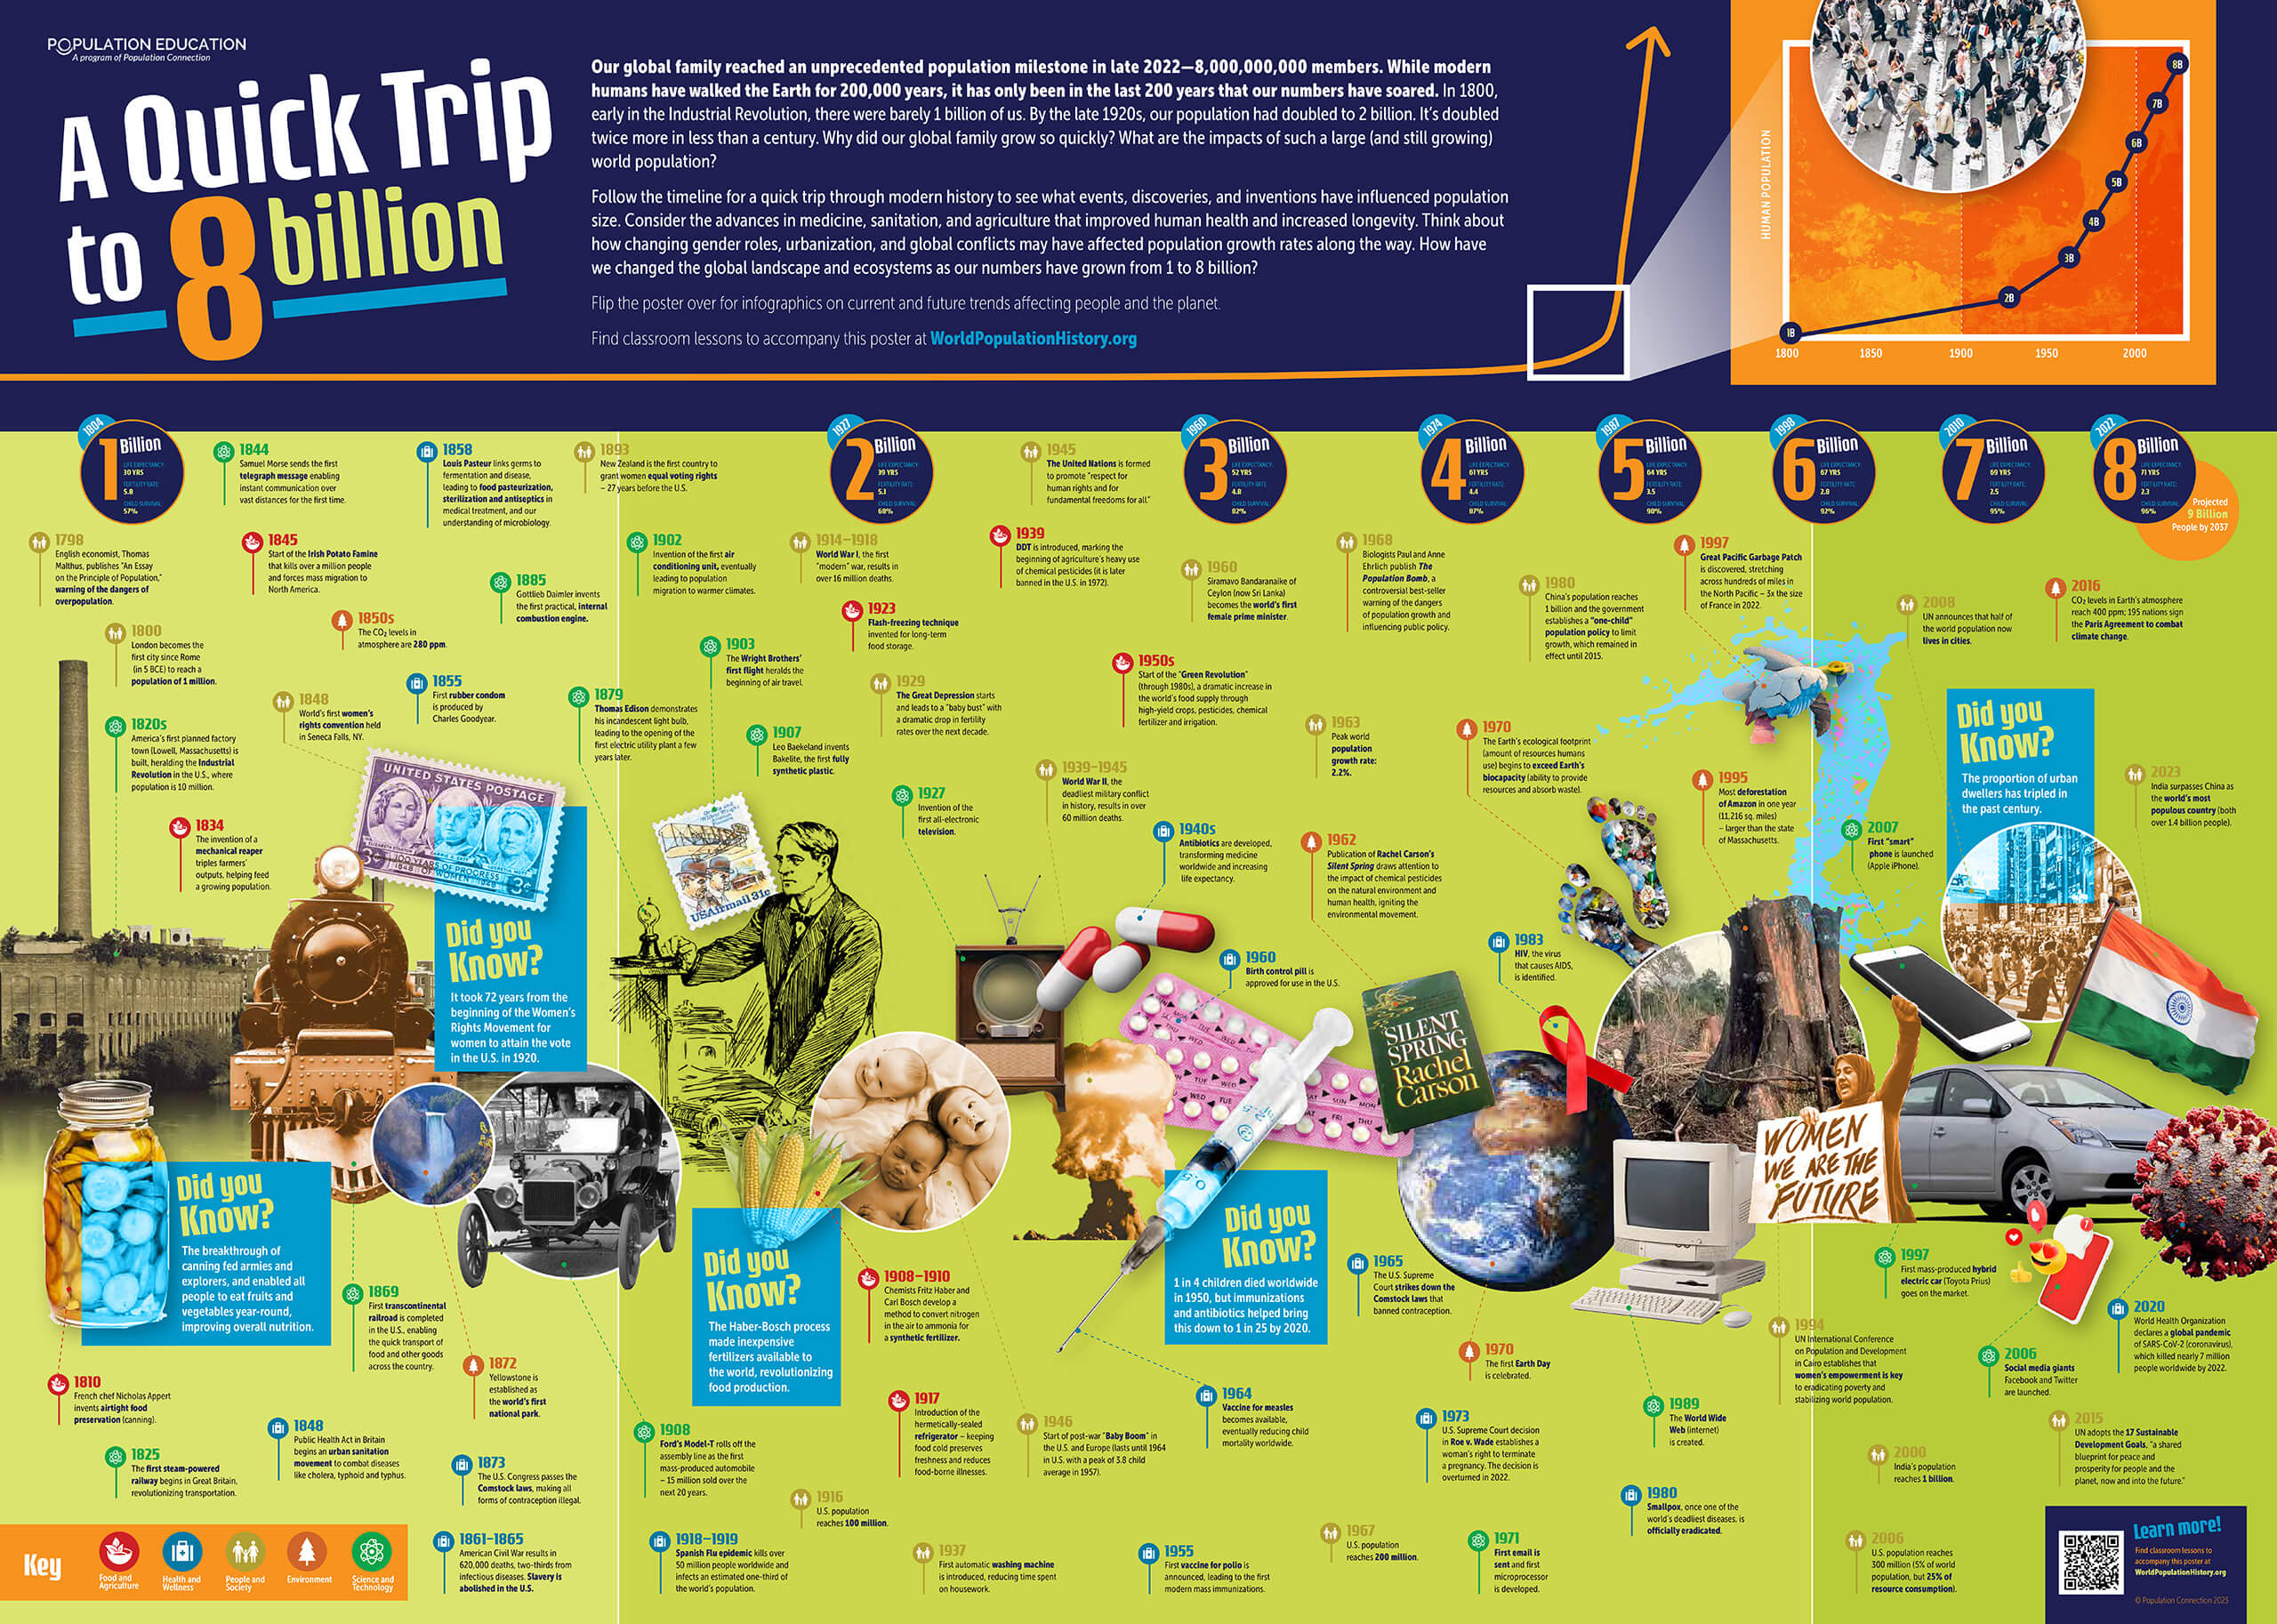
![]()
Related Lesson Plans

Exploring the Timeline
Through written analysis of the timeline on the Quick Trip to 8 Billion poster, students explore how past events have contributed to our current population size and resource use.
Download PDFInfographic Scavenger Hunt
Through collaborative analysis of visual data on the Quick Trip to 8 Billion poster, students investigate how demographics and resource use have changed over time and how we can reduce future environmental impacts.
Download PDFReport Card for the Planet
Students use the poster, Quick Trip to 8 Billion, to determine whether progress has been made in key indicators of human well-being and environmental health over the past two centuries and then evaluate what these changes mean.
Download PDFPurchase The Poster
Want the poster for your classroom? Purchase one for $5, or buy multiples for just $4/each.
Buy it now!